
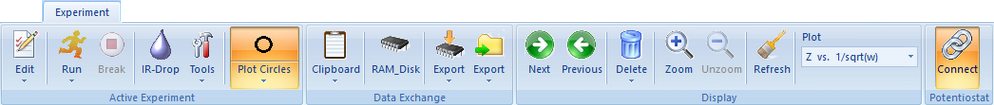
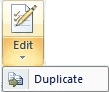
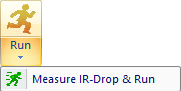
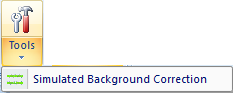
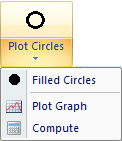
Ribbon Bar: Menu Commands


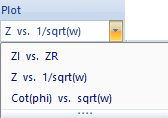

")
 vs. sqrt(w)")

Summary: Play Video
Using DigiElch for conducting electrochemical Measurements. Part I.
 The measurements shown in this video clip were conducted on mercury drops generated by the Controlled Growth Mercury Electrode (BASi).
| During the download of the video clip the scrolling of this page may be disabled! |

The following Topics demonstrated for CV-Experiments are shown in another video clip:
•Continuation of the experiments shown in Part I
•Run a series of CV-Experiments using different scan rates
•Apply Background Correction by subtracting the experimentally measured background current
•Use background-corrected CVs directly for Data Fitting
