The following picture shows the phase-angles computed in a multi-sine impedance simulation for a moderately fast (but chemically reversible) charge transfer process:
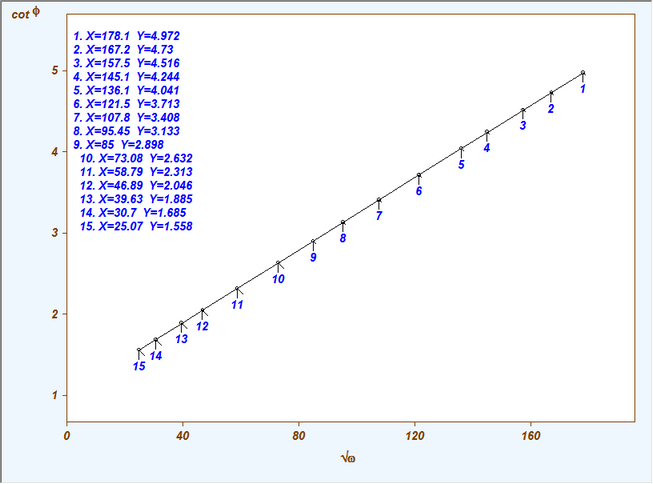
After retrieving the individual cotangent(Φ)-√ω couples by double-clicking on each point with the left mouse button the user may want to study whether
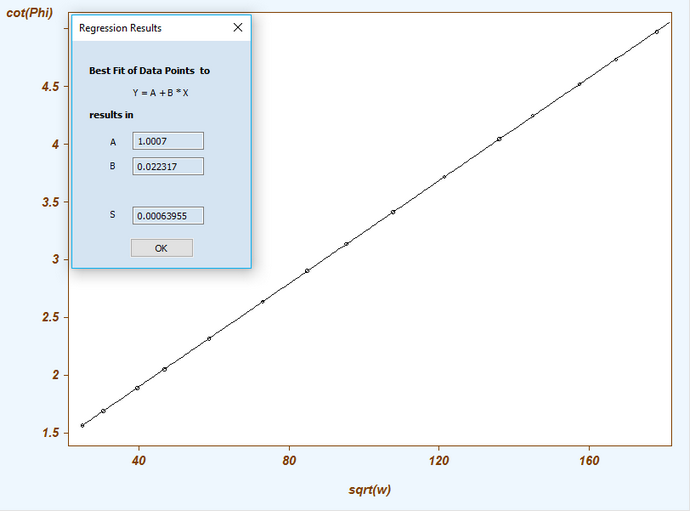
1.the intercept of the straight line is 1.0
2. the slope equals the value predicted by theory
This can be accomplished by clicking on the command button Plot Graph. It opens a dialog box
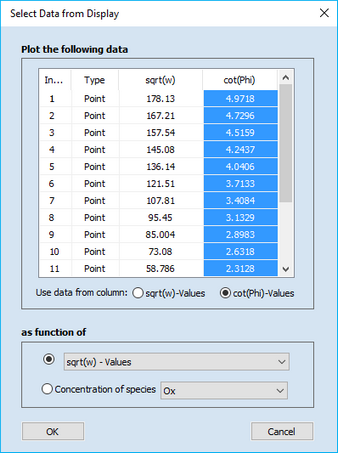
where the data in column cot(Phi)-Values and the option as function of sqrt(w)-Values has to be selected. After clicking on OK the respective graph is shown on the Tab-Window: Plot Graph. The following straight lines are obtained after applying the Ribbon Bar Command Linear in the Command-Group Fit Data.