Tabbed Window: Reference 600 Experiments |

|

|
|
Tabbed Window: Reference 600 Experiments |
|
|
Tabbed Window: Reference 600 Experiments |
|
|
|
Tabbed Window: Reference 600 Experiments |
|
|
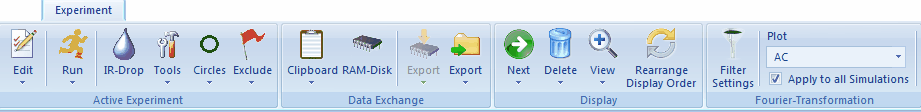
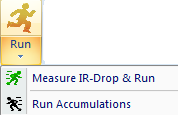
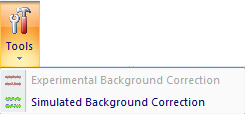
•Command: Edit •Command: Run •Command: Measure IR-Drop & Run •Command: Run Accumulations •Command: IR-Drop •Command: Experimental Background Correction •Command: Simulated Background Correction
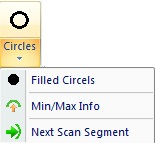
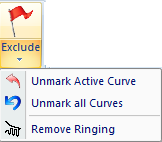
•Command: Circles •Command: Filled Circles •Command: Min/Max Info •Command: Next Scan Segment •Command: Exclude •Command: Unmark Active Curve •Command: Unmark All Curves •Command: Remove Ringing |
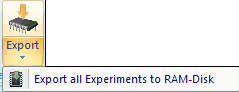
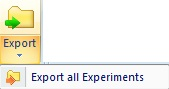
•RAM_Disk Command: RAM-Disk •RAM-Disk Command: Export •RAM-Disk Command: Export all Experiments to RAM-Disk •File Command: Export •File Command: Export all Experiments |
|
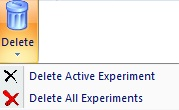
•Command: Next •Command: Previous •Command: Delete Active Experiment •Command: Delete All Experiments
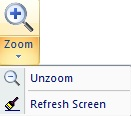
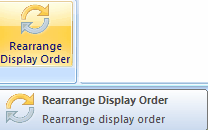
•Command: Zoom •Command: Unzoom •Command: Refresh Screen •Command: Rearrange Display Order
|
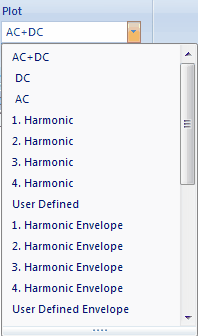
•Command: Filter Setting •Option: Plot AC + DC •Option: Plot DC •Option: Plot AC •Option: Plot 1. Harmonic •Option: Plot 2. Harmonic •Option: Plot 3. Harmonic •Option: Plot 4. Harmonic •Option: User Defined •Option: Plot 1. Harmonic Envelope •Option: Plot 2. Harmonic Envelope •Option: Plot 3. Harmonic Envelope •Option: Plot 4. Harmonic Envelope •Option: Plot User Defined Envelope •Check Box: Apply to all Simulations
|
The usage and functionality of the Ribbon Bar Commands is similar as shown in the video clip referring to a CV-Experiment Document.
|