Tabbed Window: Experiments |

|

|
|
Tabbed Window: Experiments |
|
|
Tabbed Window: Experiments |
|
|
|
Tabbed Window: Experiments |
|
|
During the download of the video clip the scrolling of this page may be disabled!
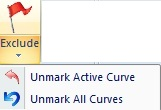
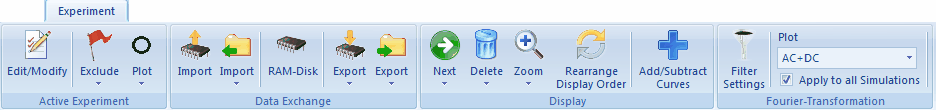
•Command: Edit/Modify •Command: Exclude •Command: Unmark Active Curve •Command: Unmark All Curves
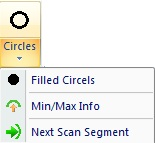
•Command: Circles •Command: Filled Circles •Command: Min/Max Info •Command: Next Scan Segment |
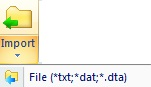
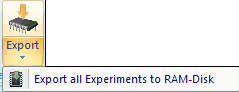
•RAM-Disk Command: Import •File Command: Import •File Command: Import File (*.txt;*.dat;*.dta) •RAM_Disk Command: RAM-Disk •RAM-Disk Command: Export •RAM-Disk Command: Export all Experiments to RAM-Disk •File Command: Export •File Command: Export all Experiments
|
||
|
•Command: Next •Command: Previous •Command: Delete Active Experiment •Command: Delete All Experiments
•Command: Zoom •Command: Unzoom •Command: Refresh Screen •Command: Rearrange Display Order •Command: Add/Subtract |
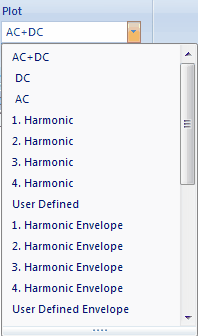
•Command: Filter Setting •Option: Plot AC + DC •Option: Plot DC •Option: Plot AC •Option: Plot 1. Harmonic •Option: Plot 2. Harmonic •Option: Plot 3. Harmonic •Option: Plot 4. Harmonic •Option: User Defined •Option: Plot 1. Harmonic Envelope •Option: Plot 2. Harmonic Envelope •Option: Plot 3. Harmonic Envelope •Option: Plot 4. Harmonic Envelope •Option: Plot User Defined Envelope •Check Box: Apply to all Simulations
|
The operation of some of these commands is shown in three video clips. Some commands peculiar to FT-CV simulations are demonstrated in the following video clip:
Topics •Running a series of FT-CV simulations for an EC-mechanism •Changing the plotting options •Exporting the FT-CV simulations to the RAM-Disk •Re-Importing the FT-CVs to use them as target curves in a Data Fitting Project •Defining the starting parameters for the fitting procedure and selecting the parameters to be optimized •Run data fitting by fitting the total AC + DC current •Rerun data fitting by fitting the second harmonic AC current component •Rerun data fitting by fitting the envelope of the third harmonic AC current component
|