The following picture shows a series of square wave voltammograms simulated for a fast chemically reversible charge transfer process using different square wave frequencies.
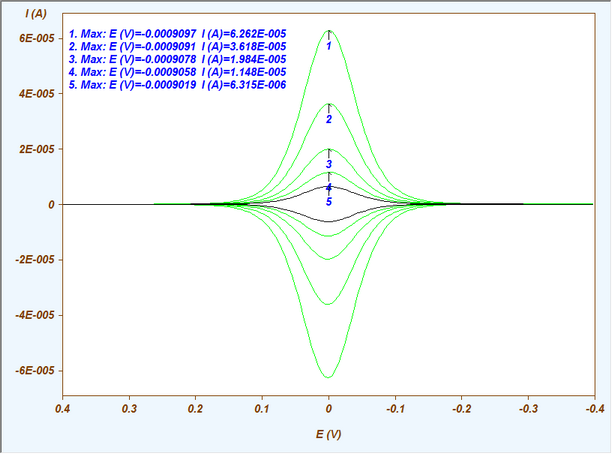
After retrieving height and position of the cathodic peak current by applying the Min/Max Info command the user may want to study whether the peak current grows linearly with the square wave frequency. This can be accomplished by clicking on the command button Plot Graph. It opens a dialog box
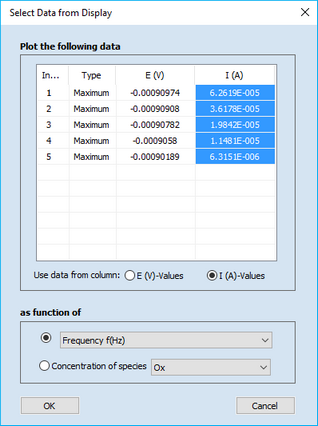
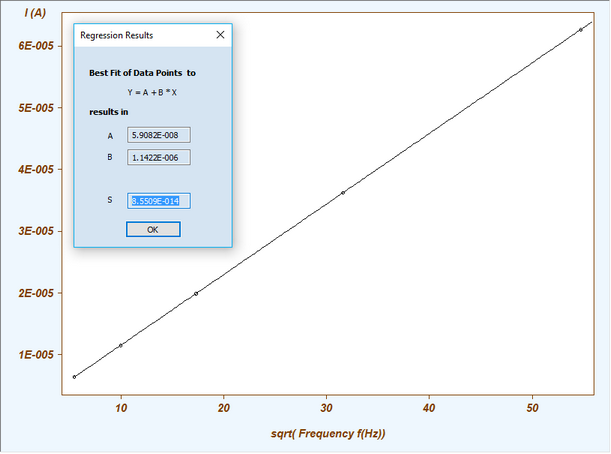
where the data in column I(A)-Values and the option "as function of Frequency f(Hz)" must be selected . After clicking on OK the respective graph is shown on the Tab-Window: Plot Graph. When selecting y vs. sqrt(x) the following straight line is obtained after applying the Ribbon Bar Command Linear in the Command-Group Fit Data.