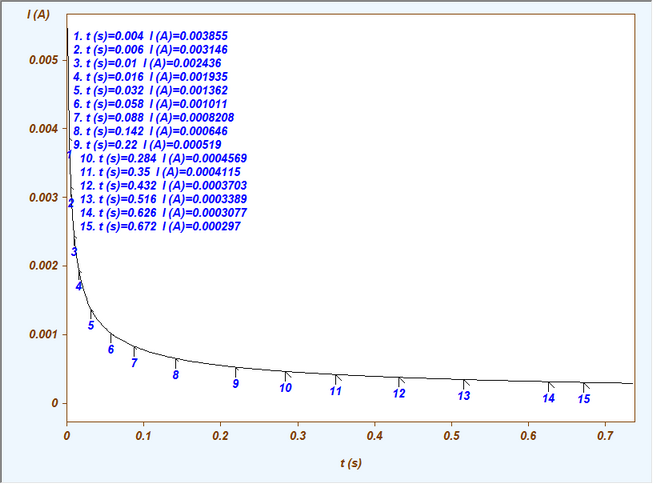
The following picture shows a CA-simulation for a moderately fast (chemically reversible) charge transfer process.
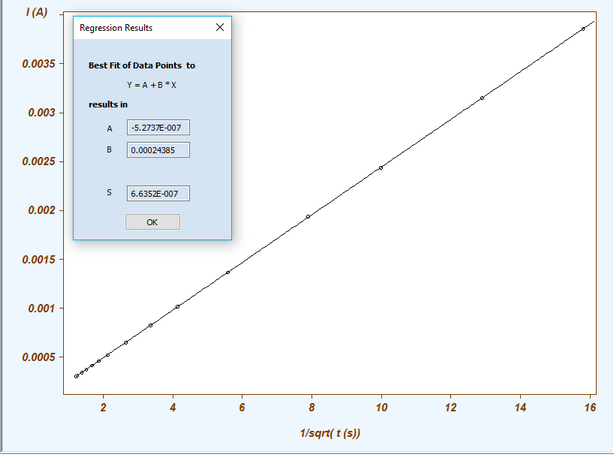
After retrieving to x-y-coordinates of some current points by double mouse click the user may want to study whether the current drops linearly with 1/sqrt(t). This can be accomplished by clicking on the command button Plot Graph. It opens a dialog box
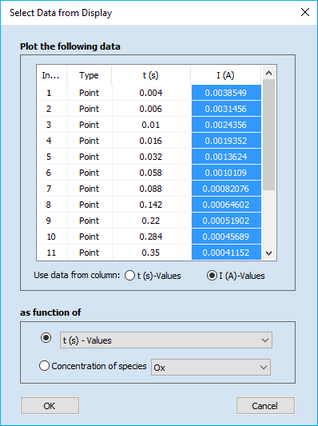
where the data in column I(A)-Values and the option "as function of t(s)-Values" must be selected . After clicking on OK the respective graph is shown on the Tab-Window: Plot Graph. When selecting y vs. 1/sqrt(x) the following straight line is obtained after applying the Ribbon Bar Command Linear in the Command-Group Fit Data.