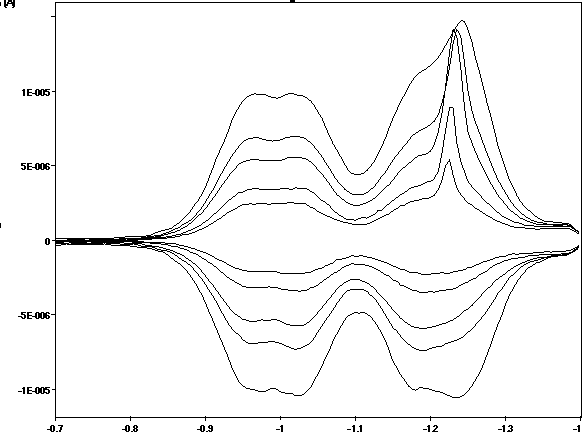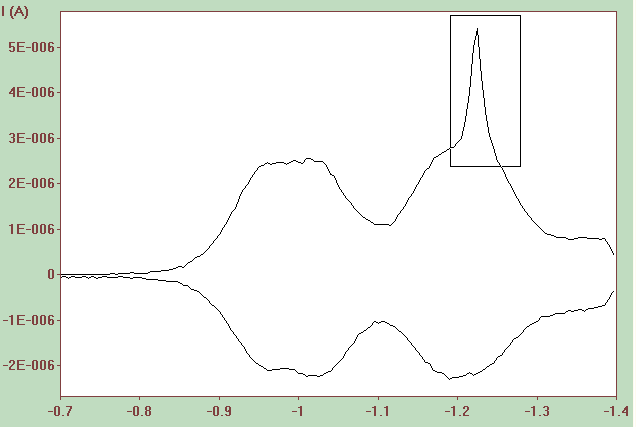
The following picture shows experimental (cyclic) square-wave voltammograms of a di-nuclear complex. The mono-nuclear species exhibits two one-electron reduction steps at about -1 and -1.2 V. In the case of the di-nuclear complex each one-electron process is split into two separate processes due to a communication between the metal centers. The potential difference representing the interaction of the metal centers is relatively small (no well separated peaks) and can be determined best by fitting the entire curves. However, the following picture reveals that the processes occurring at about -1.23V are affected by an adsorption peak:

Using the data without modification makes no sense as the fitting procedure is going to compensate this artefact by using physically nonsensical values for diffusion coefficient and charge transfer parameters. In order to retrieve at least sensible parameters for the first 2e-reduction process the adsorption peaks need to be excluded from data fitting. The latter is done in the following way:
1.Prepare a fitting project analogously as shown in the video clips. However, before starting the fitting procedure go to the Tabbed Window: Experiments and click on the icon Exclude 
2.Press down the left mouse button and draw a rectangle around the region where the adsorption peak is localized as shown below

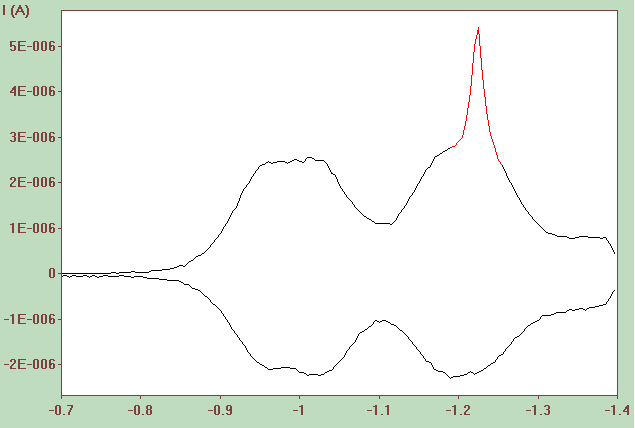
3.After releasing the mouse button the current points excluded from data fitting are plotted in red.

4.Click again on the Exclude icon to add another region for being excluded.
5.Click on Unmark Active Curve to remove all excluded regions from the active experiment or on Unmark All Curves to remove all excluded regions from the current curves shown in the Tabbed Window: Experiments.
