
This command opens a dialog box for entering x-y-couples from scratch or for editing those imported from screen info shown in the Tab-Window: Simulations or in the Tab-Window: Experiments. The import is accomplished by means of the Plot Graph command contained in the Ribbon Bar associated with the respective Tab-Window.
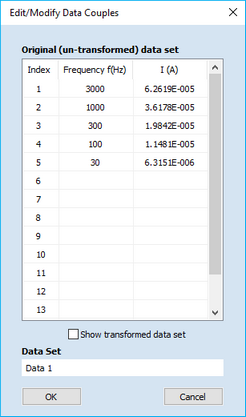
A left mouse click at the field headlined Index enables the user to Insert a new Data Couple or to Remove an imported/entered Data Couple. If not the original data but transformed ones are plotted in the Client Area of the Tab-Window:Plot Graph the latter can be viewed by ticking the Show transformed data set button. Several transformation functions and/or a scaling factor can be applied to the original x- and/or y-values. These options are provided in the Properties-Window associated with the Tab-Window:Plot Graph.
