 The data plotted in the Client Area of this Tab-Window are usually obtained by applying the Plot Graph command in the Tab-Window: Simulations or Tab-Window: Experiments. In this case the data refer to the screen info shown on the respective Tab-Window. Alternatively, x-y couples which are to be plotted can be entered fro scratch by means of the Edit command.
Ribbon Bar: Menu Commands
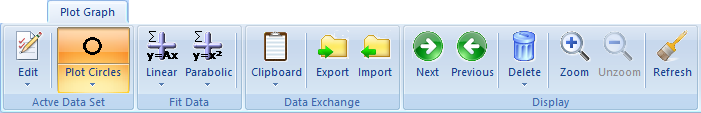
•Command: Edit 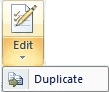
Edit the x-y-values associated with the active data set.. •Command: Duplicate
Combination of Copy, Paste & Edit •Command: Plot Circles 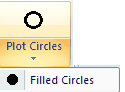
The active curve is plotted in the form of open circles. •Command: Filled Circles
The active curve is plotted in the form of filled circles.
|
•Command: Linear 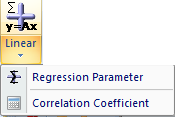
Plots a linear fit of the active data oCommand: Regression Parameters
Shows slope, intercept and standard deviation of the linear fit oCommand: Correlation Coefficient
Shows the correlation coefficient between the linear fit and the data points
•Command: Parabolic 
Plots a linear fit of the active data oCommand: Regression Parameters
Shows the definition parameters of the parabola together with the standard deviation of the parabolic fit |
 | Command Group: Data Exchange |
•Clipboard Command: Copy 
Copy the active data set and put the copy on the clipboard. •Clipboard Command: Cut
Cut the active data set and put it on the clipboard. •Clipboard Command: Paste
Paste clipboard content into the Tabbed Window: Plot Graph.
•File Command: Export 
Export the active data set as txt-file. •File Command: Import 
Opens a Windows File Dialog for selecting the txt-file(s) which are to be plotted. |
| Command Group: Display |
•Command: Next 
Activate the curve referring to the next data set. •Command: Previous
Activate the curve referring to the previous data set. •Command: Delete Active Curve 
Delete the active data set.
•Command: Delete All Curves
Delete the all data set. •Command: Zoom 
Zooms the screen display by pressing down the left mouse button and draw a rectangle around the region which is to be zoomed. The zoom command can be repeatedly applied. •Command: Unzoom
Undo the zoom command. •Command: Refresh Screen
Removes Min/Max-Info and redraws the screen display. |

