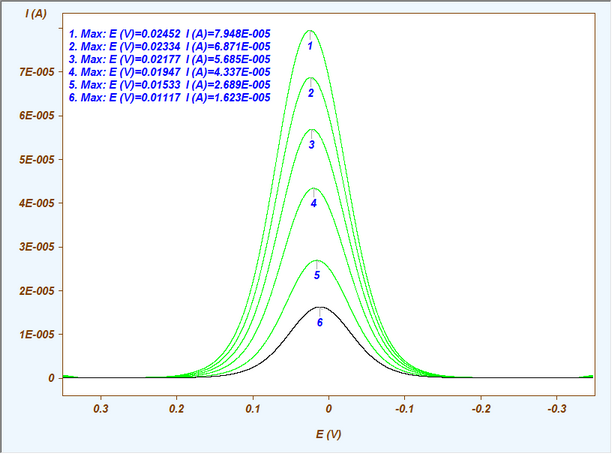
The following picture shows the 1. Harmonic Envelopes of FT-CVs simulated for the mechanism
Ox + e = Red
Red + Ox => P
using different analytical concentrations of [Ox].
After retrieving height and position of the peak current by applying the Min/Max Info command the user may want to study whether the peak current depends linearly on [Ox]. This can be accomplished by clicking on the command button Plot Graph. It opens a dialog box
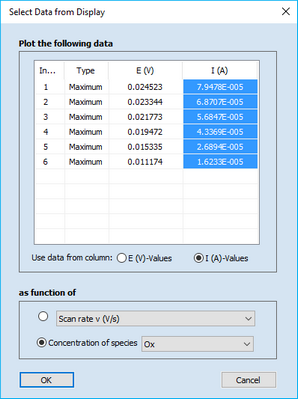
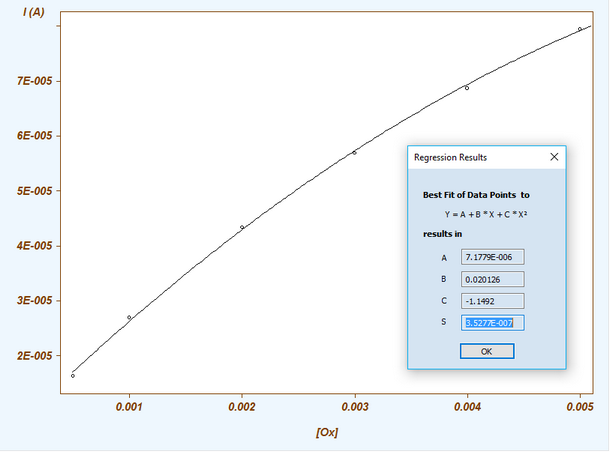
where the data in column I(A)-Values and the option "as function of Concentration of species Ox" must be selected . After clicking on OK the respective graph is shown on the Tab-Window: Plot Graph. When selecting y vs. x the following parabolic fit is obtained after applying the Ribbon Bar Command Parabolic in the Command-Group Fit Data.