Tabbed Window: Simulations |

|

|
|
Tabbed Window: Simulations |
|
|
Tabbed Window: Simulations |
|
|
|
Tabbed Window: Simulations |
|
|
During the download of the video clip the scrolling of this page may be disabled!
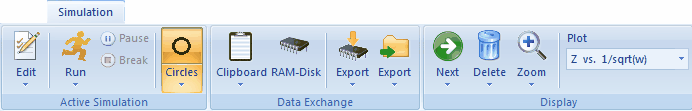
•Command: Edit Edit the simulation parameters associated with the active simulation. •Command: Duplicate Combination of Copy & Paste & Edit.
•Command: Run Runs a simulation using the default fixed-grid simulator. •Command: Adaptive Grid Simulator Runs a simulation using the adaptive-grid simulator.
•Command: Pause Pauses or continues the currently running active simulation. •Command: Break Breaks the currently running active simulation.
•Command: Compare
•Command: Circles The active current curve is plotted in the form of open circles. •Command: Filled Circles The active current curve is plotted in the form of filled circles. •Command: Min/Max Info Shows the E-I-couple referring to the minimum/maximum found in a rectangle of the screen display drawn by mouse. •Command: Next Scan Segment Activates the next scan segment If the active simulation consists of more than one. |
•Clipboard Command: Copy Copies the active simulation and puts the copy on the clipboard. •Clipboard Command: Cut Cuts the active simulation and puts it on the clipboard. •Clipboard Command: Paste Pastes clipboard content into the Tabbed Window: Simulations.
•Command: RAM-Disk Opens a dialog box showing the actual content of the RAM-Disk. The RAM-Disk stores data in use-file format and can be used, for instance, to export CVs simulated in the Tabbed Window: Simulations to the Tabbed Window: Experiments window. In this way experimental curves can be mimicked by simulated ones, for instance, in order to investigate how systematic errors such as noise are passed to individual parameter values when using these files in a fitting project.
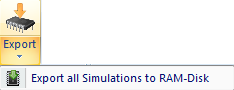
•RAM-Disk Command: Export
•RAM-Disk Command: Add all Simulation to RAM-Disk Exports all simulations shown in the Tabbed Window: Simulations in use-format and stores the use-files in the RAM-Disk.
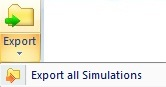
•File Command: Export Exports the active simulation in use-format and stores the use-file on hard disk. •File Command: Export all Simulations Exports all simulations shown in the Tabbed Window: Simulations in use-format and stores the use-files on the hard disk. |
||
|
•Command: Next The next current curve is activated. •Command: Previous The previous current curve is activated.
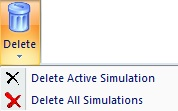
•Command: Delete Active Simulation Deletes the active simulation. •Command: Delete All Simulation Deletes all simulations shown in the Tabbed Window: Simulations.
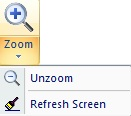
•Command: Zoom Zooms the screen display by pressing down the left mouse button and draw a rectangle around the region which is to be zoomed. The zoom command can be repeatedly applied. •Command: Unzoom Undo the zoom command. •Command: Refresh Screen Removes Min/Max-Info and redraws the screen display. •Option: Plot ZI vs. ZR •Option: Plot Z vs. 1/sqrt(ω) •Option: Plot cot(ϕ) vs. sqrt(ω) |
Topics •Running a (multi-sine) impedance simulation for a second-order catalytic mechanism •Run a second simulation using a different frequency range •Activate next or previous simulation •Modify options for displaying impedance data •Modify the default impedance signal by using a multi-sine composed of less than 15 frequency components •Plot Plot ZI vs. ZR, Plot Z vs. 1/sqrt(ω) or Plot cot(ϕ) vs. sqrt(ω)
|